End of 2024 TrenchMapper™ update
The volunteers who have diligently been working on TrenchMapper™ over the year have - between them - expanded the TrenchMapper™ portal beyond our wildest dreams. As mentioned previously, this is now the largest single location for First World War maps available anywhere, and all of these original maps can be inspected and overlaid using the technology that sits 'behind' TrenchMapper™. As detailed at the outset of the project, individual maps can be downloaded for a very small fee (WFA members can have a number of 'free' maps every month).
Here's some words from Howard Anderson, with examples of what has been produced.
Gallipoli
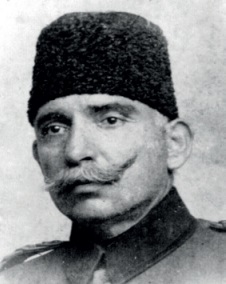
It is notable that the standard of Allied mapping of Gallipoli fell way below that of the Western Front, both in coverage and geometric (or planimetric) accuracy. The most accurate maps were drawn immediately after the evacuation by a team led by the very talented cartographer Mehmet Sevki Ölçer, known widely as Şevki Paşa.
The 43 maps in the set, drawn at a scale of 1:5,000, offer the best means to show the location of Great War features on the peninsula. They have no allied point names, all the text is in the now disused Ottoman Turkish script, (replaced in 1928 by the current Latin based script). It was decided that a new map of the peninsula with allied names and drawn as a singe sheet would be appropriate, the geometry coming from tracing of the Şevki Paşa maps and over laid with other detail.
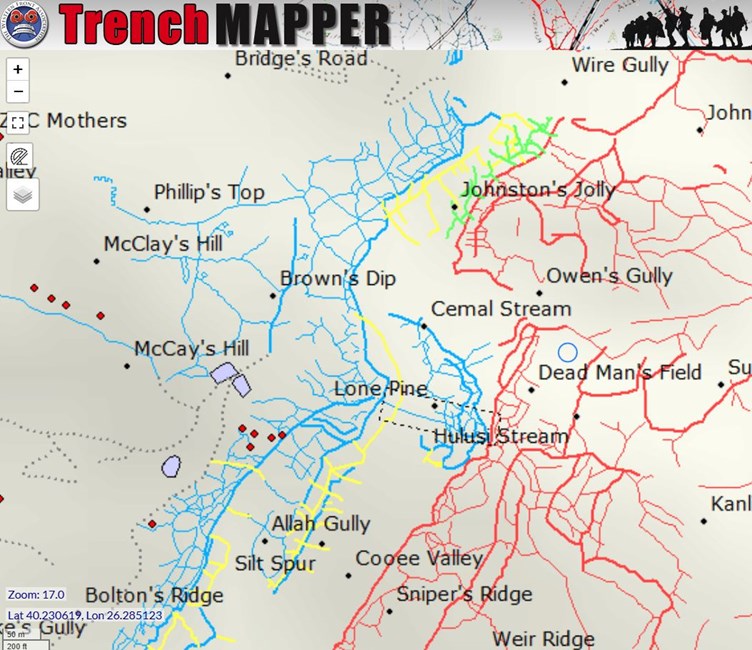
This map is shown in TrenchMapper™ here Gallipoli Post Evacuation Sheet. (Zoom in for full detail)
Messines
There many maps of the Messines mines but most leave out some of the detail. To counter this, a map was drawn to show the famous mine craters along with planned mines, the one that exploded in 1955 and the adjacent mines that are still in place. As far as possible with current but still incomplete knowledge, the tunnels used to lay the mines are also shown.
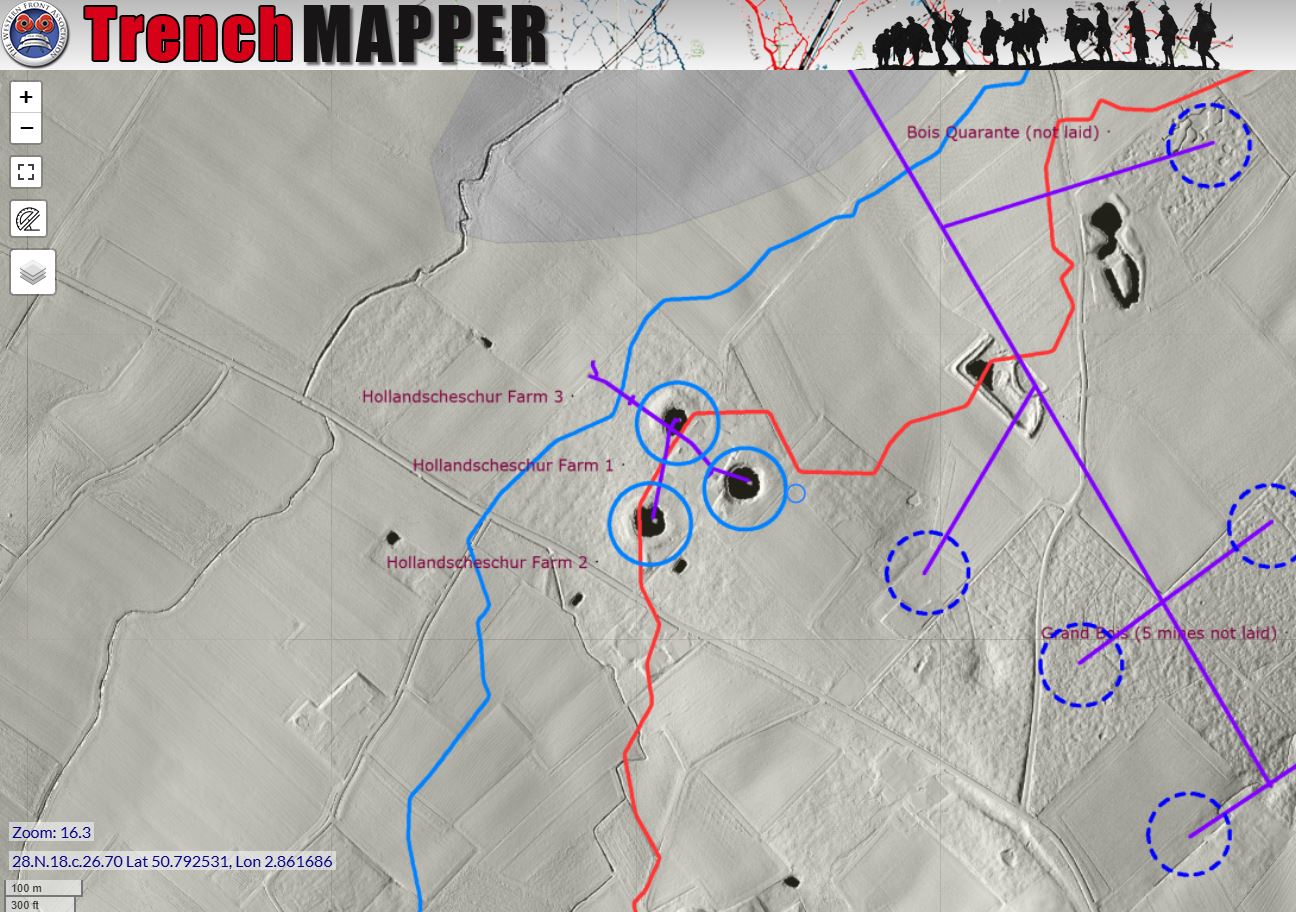
This map is based on LiDAR and is shown in TrenchMapper™ here Messines Mines Sheet
Vimy
In the example below of Vimy Ridge, the map is also based on LiDAR of the area. LiDAR shows elevation in great detail and in these cases, has been processed to strip off the trees and buildings to show the landform beneath. Aerial photographs show forest over most of the area so the craters etc. in the Zone Rouge are not visible, even visiting the area does not allow a good view as the zone is fenced off. In other areas agriculture has removed surface indications of warfare but here they are still there in amazing detail.
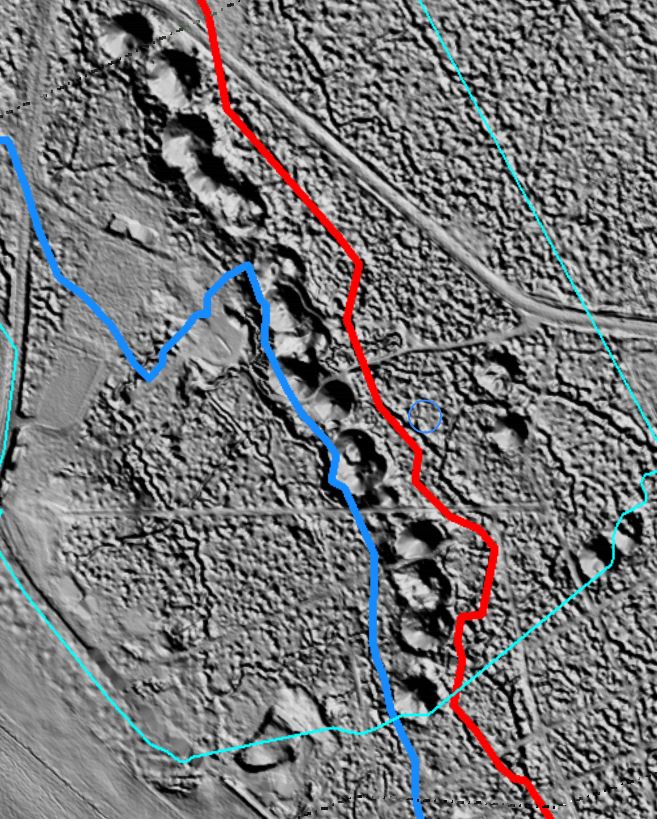
The map can be found here Vimy trenches and craters
Cuinchy
Another example shows a tracing from the Tunnelling Companies War Diaries of the heavily mined Cuinchy Sector, it shows most of the tunnels used to lay numerous mines. Click here to view this map Cuinchy Sector
All four of these maps were produced using professional GIS software, Global Mapper with data extracted from a number of sources.
Aerial Maps
The other notable inclusions are the release of almost 2,000 georeferenced aerial photographs. An example of one is the incredibly detailed outline of the underground passageways at Le Transloy, including how the Germans planned to defend them. Again, just click here to see what has been created: Underground Passageways at Le Transloy


